The following is an excerpt from: (2009) Topographic Mapping and Creation of a Digital Elevation Model of the Etowah Indian Mounds Historic Site (9BR1), Georgia. Report submitted to Dr. Adam King, South Carolina Institute of Archaeology and Anthropology.
This report describes results of a surface-mapping project by an electronic total station carried out at the Etowah Indian Mounds Historic Site (9BR1) from May 10 through 20, 2009. The total station survey was performed to record by digital means the nature of the ground surface at this important Mississippian mound site. More specifically, the project goal was to create a high-resolution Digital Elevation Model (DEM) – a computer model of the ground surface – that could serve to illustrate site surface features and be integrated with other data acquired from excavations, geophysics, and remote sensing.
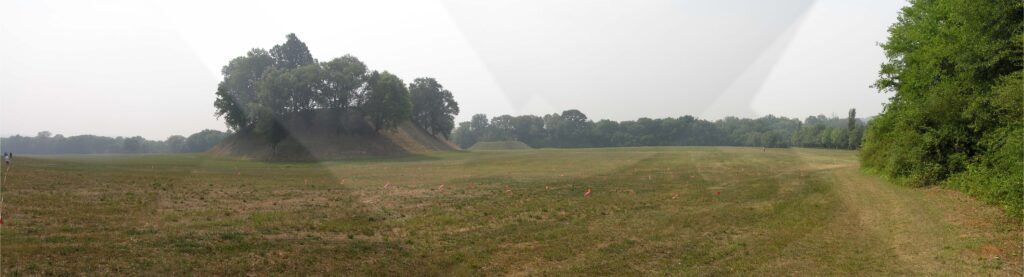
The Etowah site is one of the most famous Mississippian period mound centers in the Southeast and has been the focus of many years of archaeological research. A total of six mounds are currently documented (A-F) with the largest being Mound A, standing upwards of 19 m tall with a summit area measuring approximately 0.67 ac (0.27 ha). The site is situated on the Etowah River with a series of ditches or borrow pits that surround the site and a large plaza area located east of Mound A. Topography of the site is fairly complex including ditches or borrow pits, mound slopes of varying degrees, subtle relief in the form of possible undocumented mounds, and a wide band of low relief attributed to earlier flooding episodes of the Etowah River prior to the construction of the Allatoona Dam in the 1940s.
THE TOPOGRAPHIC SURVEY
The goal of the survey was to create a Digital Elevation Model (DEM) within the entire park boundary of the Etowah Indian Mounds Historic Site. Such a dataset provides a record of the state of the site surface, as it exists in 2009, that can serve as a baseline for subsequent change studies resulting from erosion, agricultural use (although minor), or park maintenance and development. The data are useful for visualizing the layout and form of the site and subtle landscape features that may not be easily recognizable on the surface.
The Robotic Total Station
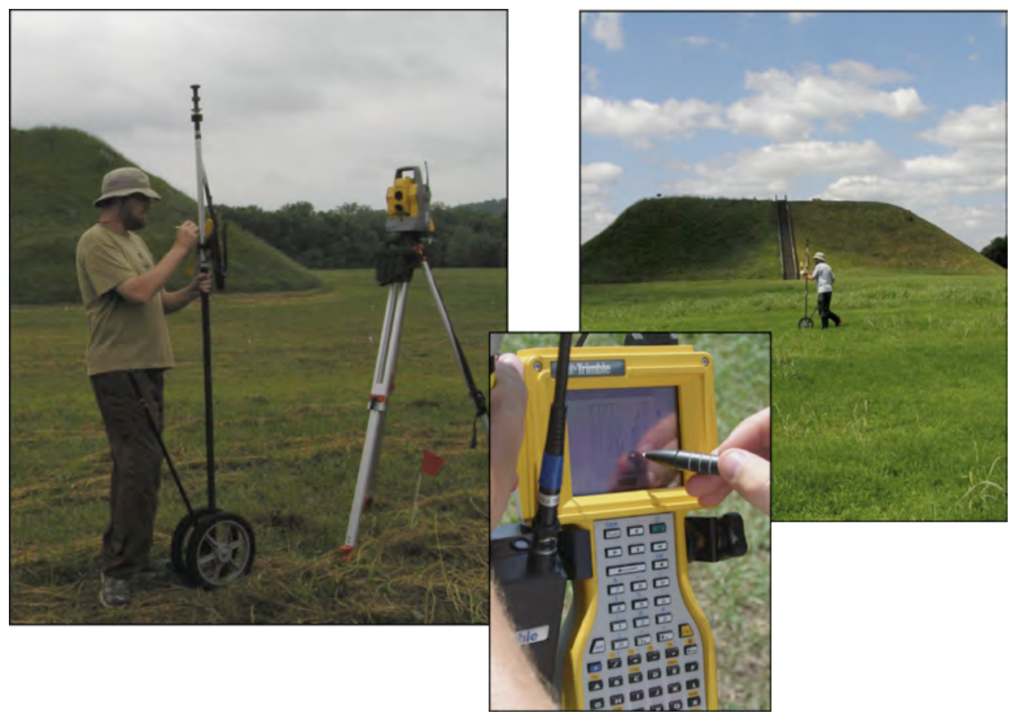
The robotic total station is an electronic distance measuring (EDM) system with many automated capabilities. The Trimble 5600 contains a highly accurate (sub-centimeter) EDM, a four-speed servo for rapid and accurate aiming, AutolockTM technology for automatic tracking of the target as it is moved, and robotic capabilities allowing a single-person survey through radio linkage (halving crew requirements). The servo-driven aiming, AutolockTM, and robotic capabilities mean that all operations may be conducted by a single person through a control pad affixed to the reflector rod that is radio-linked to the total station. A wheel attached to the base of the reflector rod allows the operator to simply roll the rod over the landscape, controlling the survey by radio from the control pad while the total station automatically tracks the roving rod and records data. Data may be acquired in a continuous mode at a rate of one measurement per second. The x, y (positional), and z (elevation) coordinates in the site coordinate system are transmitted back to the control pad on the roving unit and displayed in map form in real time. The data are easily downloaded for computer processing and map creation. The data are represented by comma delimited x, y, z data triplets in an ASCII format, amenable for input to virtually any mapping program or Geographical Information System (GIS).
Field Methods
Within the park boundaries, 50 m square data collection units were employed, with the grid aligned to the current site grid that was previously established in association with a site-wide magnetic gradiometry survey. By utilizing 50 m units, the topographic survey could be conducted piecemeal, unit-by-unit, and all data were placed in the site coordinate system. In each 50 m unit, the survey was accomplished by placing pin flags at five-meter intervals at opposite ends of each unit to serve as guides for the survey transects. Transects were made approximately every 2.5 meters by zigzagging through each 50 m unit and visually estimating approximate transect locations vis-à-vis the pin flags and the real time display on the control unit mounted on the rod. Within each transect, the wheeled reflector rod was moved at a rate of somewhat less than one meter per second to achieve better than one measurement per meter based on a continuous mode sampling rate. With the walking pace utilized, sampling density along transects was approximately one-half meter. Transect direction was north-south.
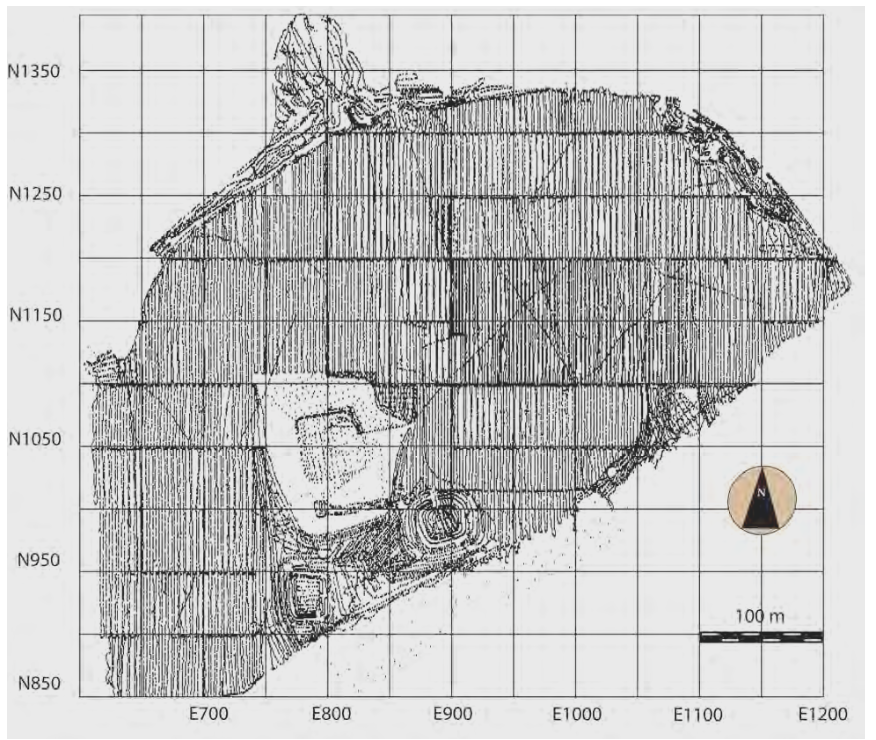
The elevations recorded during the survey were based on a permanent datum located in the southern portion of the site (N1000, E1000), with an arbitrarily assigned elevation value of 100 m at that datum. Elevations ranged from approximately 96–120 m across the survey area. A mapping of the data postings reveals much about the nature of the surveys. With data collected continuously, the zigzag surveys in 50 m collection units caused data points to accumulate at the end of each transect, or when the operator happened to stop mid-transect.
CREATION OF A DIGITAL ELEVATION MODEL
GIS “point thinning” methods were employed to reduce dense data clusters in the distribution of surveyed points by removing elements closer than 2 m (otherwise noticeable “edge effects” would occur at 50 m unit boundaries in the resultant surface from the higher density). The field data yielded a total of 78,557 elevation points. After thinning, that number was reduced to 22,268 points. A Triangulated Irregular Network or TIN model of triangular polygons was then generated based on a triangulation between the reduced set of vertices. Each triangular facet in the three-dimension surface represents a plane between three points of elevation. With “point” elevations recorded at the bottom of each surface depression, the TIN model ensures real cavities in the resulting surface, unlike many other surface-generating techniques.
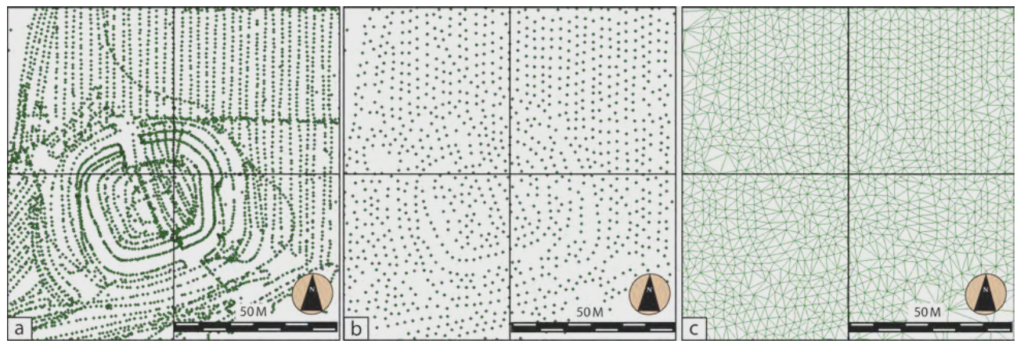
The TIN model was then used to generate an initial raster DEM with systematically distributed elevations. In this process, point-slope methods are employed to interpolate elevation values systematically, every 50 cm, across each triangular facet in the TIN, based on the known corner elevations of the facets. Using the TIN surface, a raster DEM was created of the Etowah Mound survey area. Owing to the rectangular nature of a raster, the DEM raster covers an area measuring 627 m east-west by 571 m north-south (358,017 m2) or 35.80 ha. The actual area that represents collected data is 23.18 ha (231,800 m2). The raster data set contains 1254 rows, 1142 columns, and a total of 1,432,068 elevation points. The actual area that represents collected data contains a total of 925,198 elevation points. The horizontal spatial resolution of the DEM is one-half meter.
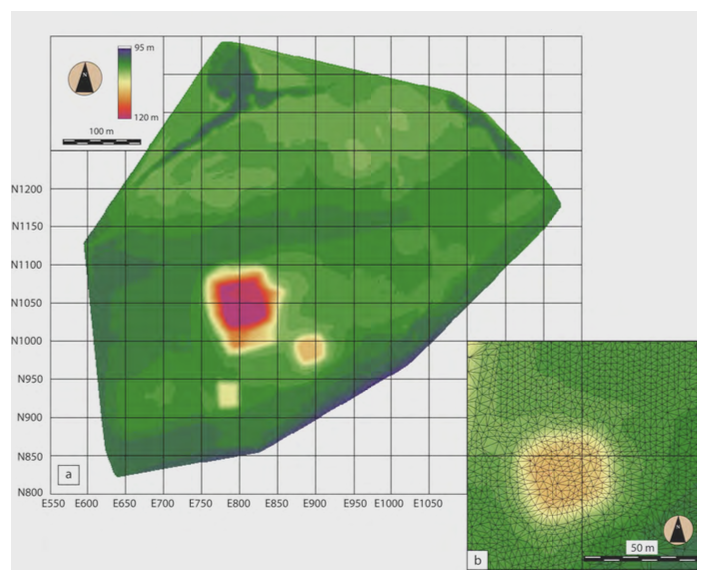
Generation of the DEM. a) Raster DEM surface of the survey area at Etowah using 30 elevation classes. b) TIN model over the raster DEM surface in the Mound B vicinity. 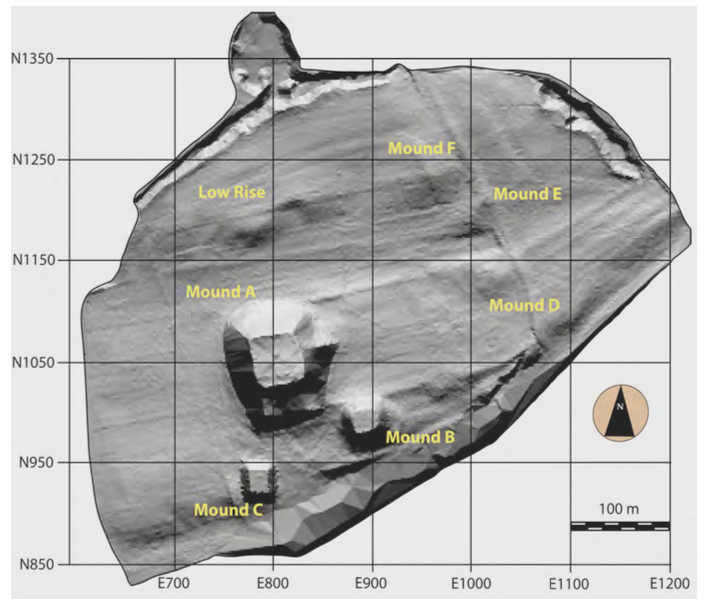
Shaded relief view of shading from the south of the final Etowah Mounds surface topography computed from the DEM.
The final site-wide DEM can be used to illustrate the topographic surface of Etowah in a variety of ways, including shaded relief maps, three-dimensional views, and contour maps with high-contour density. Shading reveals numerous landscape features, such as three mounds located to the east of Mound A (Mounds D, E, and F), an additional low rise to the north of Mound A, and the extent of fortification ditches/borrow pits. The linear feature running across the eastern portion of the site is the current service road that is slightly elevated with gravel.
CONCLUSIONS
The fieldwork performed from May 10 through 20, 2009 at the Etowah Indian Mounds Historic Site (9BR1) saw the topographic survey of the site with the acquisition of over 78,000 elevation points. The mapping was accomplished by the use of a robotic total station with data sampled at high-density spatial resolution and vertical accuracy to approximately a centimeter. GIS methods were applied to these data to generate a DEM of the site surface with half-meter spatial resolution. This model of 23.18 ha (231,800 m2) contains great detail and illustrates numerous landscape features, such as three mounds located to the east of Mound A (Mounds D, E, and F), an additional low rise to the north of Mound A, and the extent of fortification ditches/borrow pits. The survey represents an important data source that documents the state of the site, as it exists in 2009.
For more information:
| Burrough, Peter A., and Rachel A. McDonnell 1998 Principles of Geographical Information Systems. Oxford University Press, Oxford. King, Adam 2003 Over A Century of Explorations at Etowah. Journal of Archaeological Research 11(4):279-306. King, Adam 2003 Etowah: The Political History of a Chiefdom Capital. University of Alabama Press, Tuscaloosa. Kvamme, Kenneth L., Eileen G. Ernenwein, and Christine J. Markussen 2006 Robotic total station for microtopographic mapping: an example from the Northern Great Plains. Archaeological Prospection 13:91-102. Walker, Chester P. 2009 Landscape Archaeo-Geophysics: a study of Magnetometer surveys from Etowah (9BR1), The George C. Davis Site (41CE14), and the Hill Farm Site (41BW169). P.h.D. dissertation, Department of Anthropology, University of Texas at Austin. |