The following is an excerpt from: (2019) Geophysical Survey at Historic Fairview Cemetery, Van Buren, Arkansas . Report submitted to Tim Mulvihill, Arkansas Archeological Survey, Ft. Smith, Arkansas.
In March 2013, a team of University of Arkansas-Ft. Smith students, supervised by Dr. Duncan P. McKinnon, performed a multi-instrument geophysical survey of a section of the Historic Fairview Cemetery in Van Buren, Arkansas. The goal of this project was to provide insight to a specified section of the Fairview Cemetery that has no formal markings of presumed historic period burial plots. Using a geophysical analysis, it was hoped to ascertain the probability of unmarked burials for future mapping and surface recognition. This was to be accomplished through a multi-instrument geophysical collection method, allowing for a more corroborative post-collection analysis of the survey area.
PROJECT AREA
The historic Fairview Cemetery is a 10-acre plot located on Fayetteville Road (AR Hwy. 59) north of downtown Van Buren, Arkansas. It was deeded to the City of Van Buren in 1837 by its co-founder John Drennen. A total of close to 3,000 burials are situated within the Fairview Cemetery, including 419 Confederate soldiers and approximately 90 African-American slaves, were buried in the cemetery between 1848 and 1864. The Confederate portion of the Fairview Cemetery was placed on the National Historic Register in 1996 and the remainder of the cemetery was placed on the National Historic Register in 2005.
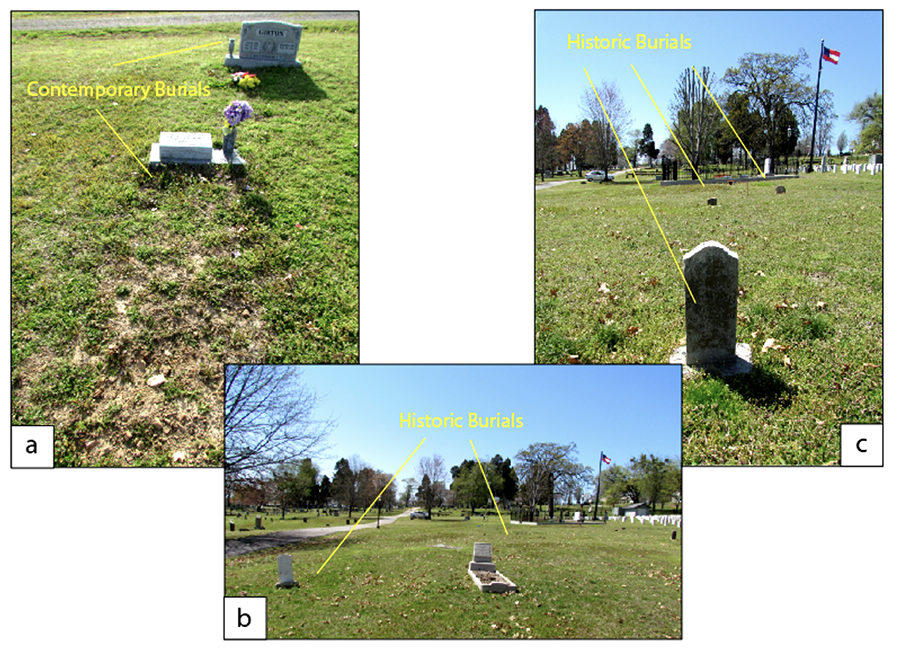
A 20 x 60 m grid was selected based on the lack of formal burial markings, the presence of several topographic depressions, and historic lore that this portion of the cemetery contains several African-American unmarked slave burials. The survey area is fairly level with no trees or vegetation. A few historic and contemporary burials are marked within the survey area.
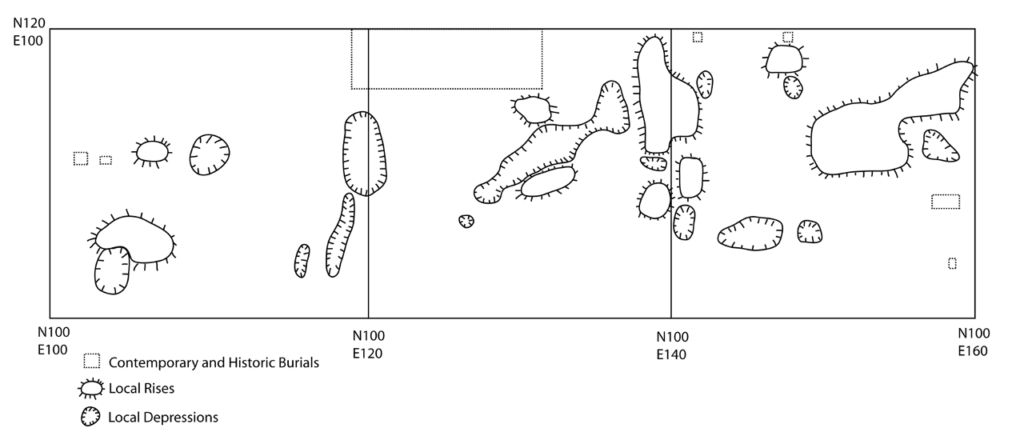
Students recorded additional features present within the survey area, such as topographic rises and depressions (often indicative of burials), modern utilities, and the location of visible cemetery stones. The surface sketch map was used to assist with the post-collection interpretation process.
DATA COLLECTION AND INSTRUMENTS
Geophysical data was collected in the 20 x 60 m grid area over the course of three Saturday field days. A multi-instrument method was used that employed magnetic gradiometry, electrical resistance, and electromatic induction (magnetic susceptibility and electrical conductivity).
Magnetic Gradiometry
Magnetic gradiometry is measured as the net effect of magnetic variations in the shallow subsurface soil matrix (approximately 1-2 m). The measurement of magnetic gradiometry is conducted using a passive approach, in that the instrumentation measures the naturally occurring magnetic field without emitting a magnetic field, pulse, or current into the subsurface. Magnetic gradiometers calculate the real-time difference of the two vertically separated sensors as the survey is conducted and measurements are simultaneously being recorded. This difference yields a vertical gradient measurement of the magnetic field free of diurnal variations. The vertical gradient is measured and reported in nanoteslas (nT; 10-9 Tesla).
The magnetic gradiometer used in this research is a Bartington Grad 601-2 Dual Sensor Gradiometer (see Bartington and Chapman 2004). The Grad 601-2 is a vertical component fluxgate gradiometer containing two cylindrical sensor assemblies. Each cylindrical sensor assembly contains two mounted sensors with a 1-meter vertical spatial separation that measure the vertical component of the magnetic field. Since magnetic strength decreases with the cube of distance (1/d3), the lower sensor is more sensitive to subsurface readings whereas the opposite upper sensor is more sensitive to Earth’s magnetic field. Simple differencing of the two readings removes the effects of the latter.
Collection spacing along each transect (Y) was set to 0.125-meter spacing (8 samples per meter) and regulated using a focused and practiced walking pace of 1.3 meters/second. Data were collected using a zigzag pattern.
Electrical Resistivity
Electrical resistance surveys measure the level of resistance (R) in the subsurface by injecting a current (I) into the ground using a low voltage (V) resistance meter. The ratio of current to voltage defines resistance and is expressed by Ohm’s Law, mathematically stating that R=I/V. Electrical resistivity is measured and reported in ohm-meters.
Variations in resistance measurements are based on the principle that geological features hold different materials and different amounts of moisture. These varying levels of resistance can be influenced through anthropogenic (and natural) processes that alter the compaction of the soil resulting in a change of soil moisture properties.
The Geoscan Research Advanced RM15 with MPX15 Multiplexer was used in this survey. A twin-probe array configuration was utilized. With a twin probe-array configuration, a minimum of two probes, one for current and one for potential (voltage), are mounted to a mobile frame and are connected by a cable to a current-potential pair of stationary remote probes that have been inserted into the ground at a distance of 30 times the spacing between the mounted mobile probes. For the resistance survey in this research, mobile probe spacing was set at 0.5 meters allowing for a maximum prospection range of depth to approximately 0.75 meters.
Collection spacing between transects (Y) and along the baselines (X) were each set to half-meter spacing. Current (I) ranges were set to 1 mA at an output voltage (V) of 40 V allowing for a resolution of 0.0005 ohms. Data were collected using a zigzag pattern.
Electromagnetic Induction
Electromagnetic (EM) induction instrumentation uses a near surface transmitter coil to emit radio frequency electromagnetic waves into the subsurface. Objects within the subsurface matrix respond by generating eddy currents that produce a secondary electromagnetic field. This secondary electromagnetic field is proportional to conductivity, which is detected by a receiver coil on the instrument and recorded by an attached data-logger.
Electromagnetic conductivity measures the “ability of the soil to conduct an electric current” (Clay 2006:79) and is recorded in milliSiemens (mS/m). The transmission of the quadrature-phase component of the induced electromagnetic field signal is related to the mineral and chemical composition of the soil. Soils high in clay or saline composition will produce higher conductivity measurements, whereas soils composed of sand or silt will produce a lower conductivity measurement.
Magnetic susceptibility measures a material’s ability to be magnetized. It is different from magnetic gradiometry in that susceptibility is an active measurement recorded in the presence of an inducing magnetic field. The transmission of the in- phase component of the induced electromagnetic field is based on the presence of a topsoil matrix with greater magnetism than the subsoil matrix or materials. The increase in magnetism in topsoil is the result of enhancement from hematite, magnetite and maghemite minerals in pedogenesis. Additionally, changes to the magnetic composition of the soil can be caused by human activity, such as fire or the movement of magnetically rich topsoil.
The Geonics Limited EM38B was used in this research. The EM38B allows for simultaneous collection of both quadrature-phase (electromagnetic conductivity) and in-phase (magnetic susceptibility) components. This allowed for rapid acquisition of two equally contributive data sets with only one instrument “pass” along each transect. Collection spacing between transects (Y) was set to four samples per meter. Spacing along the baselines (X) was set at 0.5-meters. Data were collected in a unidirectional pattern.
INTERPRETATION RESULTS
The identification of burial locations using various geophysical methods can be challenging and frequently subsurface complexities, such as tree roots, rock caches and introduced metal, can add to the challenges. The use of a multi-instrument survey method can assist with interpretations, revealing repetitive sets of anomalies in each instrument data set.
Electrical Resistance Results
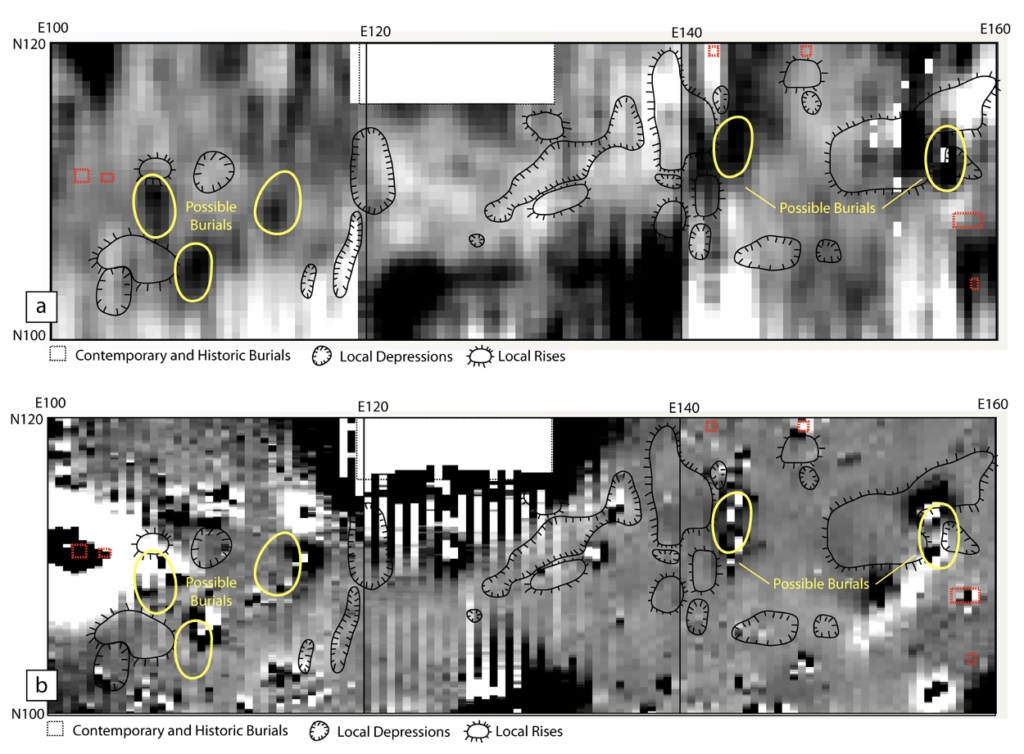
The data reveal two areas contain potential burials. In the western-most grid (left), three possible burial locatIons are highlighted. They represent high resistance anomalies that are proximate to surface topography. In the eastern-most grid (right) two possible burial locations are highlighted. They also represent high resistance anomalies that are proximate to surface topography.
The large high resistance anomalies in the center-most grid likely represent modified or deposited earth fill as a result of the road that passes close by to the south. There are no interpreted burials in the center grid.
Magnetic gradiometry Results
The survey area contains number metal spikes that are a result of contemporary headstones (and the metal rebar) and general metal litter (lost keys, bottle caps, mower parts, etc.). Nonetheless, the data do reveal two areas contain potential burials that coorelate with resistance interpretations (Figure 4b). In the western-most grid (left), the three possible burial locaitons contain evidence of metal debris and could represent buried casket hardware or a base of a former stone marker. In the eastern-most grid (right) the two possible burial locations also contain evidence of metal debris that correlates with the resistance interpretations.
Electromagnetic Induction Results
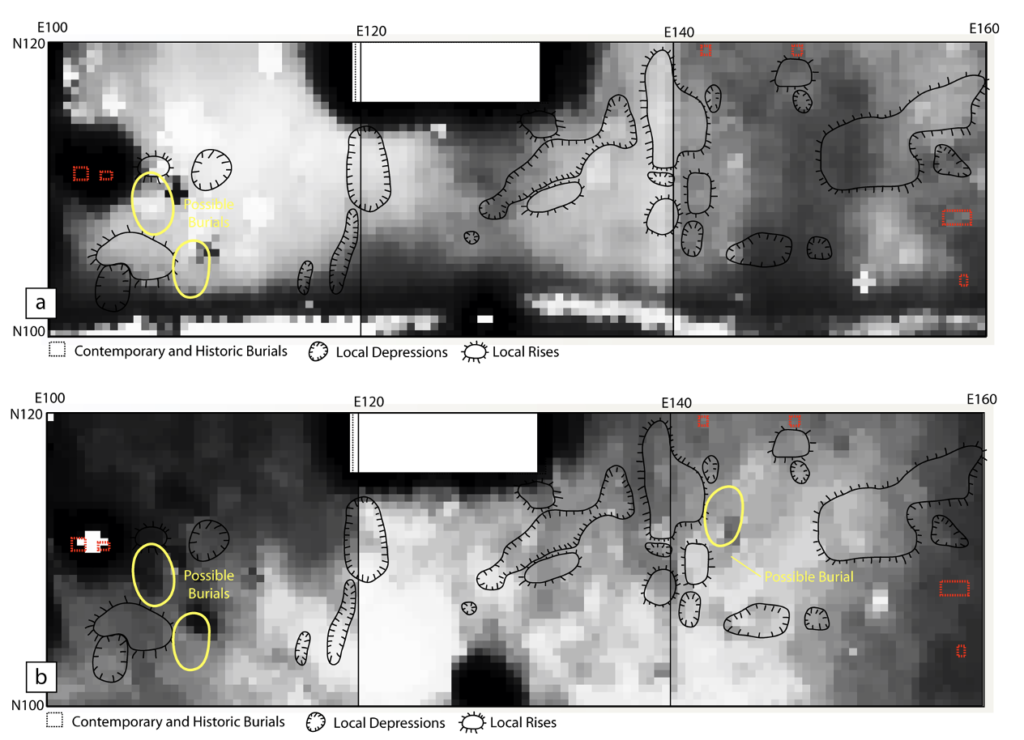
Possible burials identified in the electrical resistance and magnetic gradiometry are not as well represented in the electromagntic induction (conductivity and magnetic susceptibility). Conductivity results suggest two possible burials in the western-most grid. They are suggested based on the presence of two high conductive anomalies that also correspond with the electrical resistance and magnetic gradiometry surveys. The long linear band to the south is another example of road disturbance.
Magnetic susceptibility results suggest the same two burials in the western-most grid as well as a third in the eastern-most grid. These are suggested based upon small concentrated anomalies that correspond with other datasets.
Variations in soil deposition, complex topography and other subsurface disturbances such a bioturbation and other perturbations could lead to “false positive” anomalies. These variations in site composition could also lead to an assignment of “false negatives”, where archaeological remains in fact do exist but are not represented definitively in the geophysical survey data.
A multi-instrumentation approach allows for a comparative analysis of the disparate geophysical collection methods and further contributes to the corroboration of post-collection processing interpretation. Archival research of a surveyed area can also provide valuable information toward an understanding of the history of the site and potential disturbances that could produce false or negative anomalous results.
For more information:
| Clark, Anthony 1996 Seeing Beneath the Soil: Prospecting Methods in Archaeology (New Edition). Revised Edition. B. T. Batsford Ltd., London Dalan, Rinita. A. 2006 Magnetic Susceptibility. In Remote Sensing for Archaeology: An Explicitly North American Perspective, edited by Jay K. Johnson, pp. 161-203. University of Alabama Press, Tuscaloosa, Alabama. Kvamme, Kenneth L. 2006 Magnetometry: Nature’s Gift to Archaeology. In Remote Sensing in Archaeology, An Explicitly North American Perspective, edited by Jay K. Johnson, pp. 205-233. University of Alabama Press, Tuscaloosa, Alabama. McKinnon, Duncan P., and Bryan S. Haley 2017 Archaeological Remote Sensing in North America: Innovative Techniques for Anthropological Applications, edited by Duncan P. McKinnon and Bryan S. Haley. University of Alabama Press. Somers, Lewis 2006 Resistivity Survey. In Remote Sensing in Archaeology: An Explicitly North American Perspective, edited by Jay K. Johnson, pp. 109-129. University of Alabama Press, Tuscaloosa, Alabama. |